Questões de Concurso
Sobre vocabulário | vocabulary em inglês
Foram encontradas 3.148 questões


Text 4 to answer question.

Text 6 to answer question.

Internet: <http://joshuareich.org/2013/08/20/its-tuesday-afternoon-yourmotivation-is-low/>. Access: 12 Dec. 2015.
Text 6 to answer question.
Internet: <http://joshuareich.org/2013/08/20/its-tuesday-afternoon-yourmotivation-is-low/>. Access: 12 Dec. 2015.
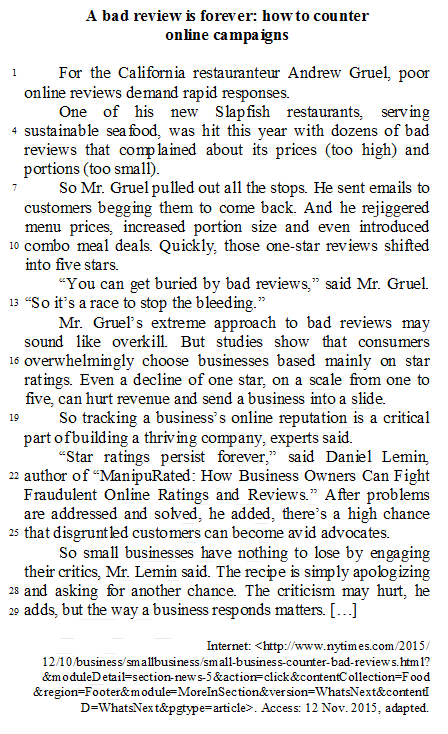
Donald Trump on Monday proposed collapsing the federal income tax rate from seven brackets down to three and called for allowing child-care expenses to be exempt from taxation in a speech allies hope will help the GOP presidential nominee turn the page on a tumultuous period some Republicans fear has severely damaged his campaign.
Overall, Trump offered few new details behind his economic vision, which he unveiled as a candidate last year. One notable exception was his call to enable families to "fully deduct" child-care expenses from their taxes. Some such expenses are already deductible; experts say that the additional amounts will largely benefit middle- and upper middle-class families.
On tax rates, business mogul said he would work with House Republicans and use the same three brackets they have proposed: 12 percent, 25 percent and 33 percent. Previously, Trump proposed tax brackets of 0 percent, 10 percent, 20 percent and 25 percent.
"For many American workers, their tax rate will be zero," said Trump.
The GOP nominee continued to leave large question marks about how he would pay for his plans and avoid ballooning the federal budget deficit. He included no new details on how he would limit the cost of his tax reform plan, which analysts have estimated would reduce federal revenues by as much as $10 trillion over a decade. His child-care expense plan would presumably raise that cost even further.
Trump released a tax plan last year that would reduce the top income tax rate from 39.6 percent to 25 percent and bring down the top corporate rate from 35 percent to 15 percent. The plan would eliminate the estate tax and reduce tax rates to 10 percent for households earning $100,000 or less.
Trump also did not spell out any federal spending cuts. In his remarks, Trump said he would offer more details in the coming weeks.
(Adapted from https://www.washingtonpost.com/news/post-politics/wp/2016/08/08/trump-to-call-for-excluding-child-care-costs-from-taxation-as- hetries-to-turn-the-page-on-a-bruising-week/?wpisrc=nl_evening&wpmm=1)
Donald Trump on Monday proposed collapsing the federal income tax rate from seven brackets down to three and called for allowing child-care expenses to be exempt from taxation in a speech allies hope will help the GOP presidential nominee turn the page on a tumultuous period some Republicans fear has severely damaged his campaign.
Overall, Trump offered few new details behind his economic vision, which he unveiled as a candidate last year. One notable exception was his call to enable families to "fully deduct" child-care expenses from their taxes. Some such expenses are already deductible; experts say that the additional amounts will largely benefit middle- and upper middle-class families.
On tax rates, business mogul said he would work with House Republicans and use the same three brackets they have proposed: 12 percent, 25 percent and 33 percent. Previously, Trump proposed tax brackets of 0 percent, 10 percent, 20 percent and 25 percent.
"For many American workers, their tax rate will be zero," said Trump.
The GOP nominee continued to leave large question marks about how he would pay for his plans and avoid ballooning the federal budget deficit. He included no new details on how he would limit the cost of his tax reform plan, which analysts have estimated would reduce federal revenues by as much as $10 trillion over a decade. His child-care expense plan would presumably raise that cost even further.
Trump released a tax plan last year that would reduce the top income tax rate from 39.6 percent to 25 percent and bring down the top corporate rate from 35 percent to 15 percent. The plan would eliminate the estate tax and reduce tax rates to 10 percent for households earning $100,000 or less.
Trump also did not spell out any federal spending cuts. In his remarks, Trump said he would offer more details in the coming weeks.
(Adapted from https://www.washingtonpost.com/news/post-politics/wp/2016/08/08/trump-to-call-for-excluding-child-care-costs-from-taxation-as- hetries-to-turn-the-page-on-a-bruising-week/?wpisrc=nl_evening&wpmm=1)


Atenção: As questões de números 56 a 60 referem-se ao texto apresentado abaixo. As cores originais dos mapas 2, 3 e 4 foram
alteradas para visualização em tons de cinza.
Using analysis, we can feel confident in the spatial patterns we see, and in the decisions that we make.
Putting your data on a map is an important first step for finding patterns and understanding trends. Here we’re looking at crimes that happened in San Francisco, about 37,000 of them. Looking at the points on a map, can you find the clusters or patterns in this point data? Can you decide where the police department should allocate its resources? Just looking at points on a map is often not enough to answer questions or make decisions using this kind of point data. That’s where the spatial analysis tools in ArcGIS come in.

We’ve all seen heat maps on TV or in web application-beautiful maps that show high-density areas in bright red, and low-density
areas in blue. These maps are used to visualize crime, disease, and a whole host of other types of data and information. These heat
maps can be a great first step in a visual analysis of your data  they can also be very subjective. What does that mean? Well,
the two heat maps shown below reflect the same San Francisco Crime data, and were created using the same tool. The only difference
is the criteria that were used to decide what appears very dark (high density) and what appears very light (low density). These types of
cartographic elements that we incorporate into our maps can have a huge impact on the story that the map tells.
they can also be very subjective. What does that mean? Well,
the two heat maps shown below reflect the same San Francisco Crime data, and were created using the same tool. The only difference
is the criteria that were used to decide what appears very dark (high density) and what appears very light (low density). These types of
cartographic elements that we incorporate into our maps can have a huge impact on the story that the map tells.

If the decisions that you’re trying to make as a result of your analyses are important, and they usually are, you’ll want to
minimize subjectivity as much  . A great way to minimize the subjectivity in your pattern analysis is to use a hot spot analysis,
which incorporates a simple spatial statistic to determine if the patterns that you’re seeing are statistically significant or not. The hot
spot map is shown here.
. A great way to minimize the subjectivity in your pattern analysis is to use a hot spot analysis,
which incorporates a simple spatial statistic to determine if the patterns that you’re seeing are statistically significant or not. The hot
spot map is shown here.

So what makes this type of map any less subjective than density-based heat maps? The very dark areas on hot spot maps are statistically significant clusters of high values (hot spots), and the very light areas are statistically significant clusters of low values (cold spots). What’s dark and what’s light is always based on statistical significance. Using hot spot analysis, we can feel confident in the spatial patterns that we see, and in the decisions that we make.(Adapted from: http://resources.arcgis.com/en/communities/analysis/017z00000015000000.htm
Atenção: As questões de números 56 a 60 referem-se ao texto apresentado abaixo. As cores originais dos mapas 2, 3 e 4 foram
alteradas para visualização em tons de cinza.
Using analysis, we can feel confident in the spatial patterns we see, and in the decisions that we make.
Putting your data on a map is an important first step for finding patterns and understanding trends. Here we’re looking at crimes that happened in San Francisco, about 37,000 of them. Looking at the points on a map, can you find the clusters or patterns in this point data? Can you decide where the police department should allocate its resources? Just looking at points on a map is often not enough to answer questions or make decisions using this kind of point data. That’s where the spatial analysis tools in ArcGIS come in.
We’ve all seen heat maps on TV or in web application-beautiful maps that show high-density areas in bright red, and low-density
areas in blue. These maps are used to visualize crime, disease, and a whole host of other types of data and information. These heat
maps can be a great first step in a visual analysis of your data they can also be very subjective. What does that mean? Well,
the two heat maps shown below reflect the same San Francisco Crime data, and were created using the same tool. The only difference
is the criteria that were used to decide what appears very dark (high density) and what appears very light (low density). These types of
cartographic elements that we incorporate into our maps can have a huge impact on the story that the map tells.
If the decisions that you’re trying to make as a result of your analyses are important, and they usually are, you’ll want to
minimize subjectivity as much . A great way to minimize the subjectivity in your pattern analysis is to use a hot spot analysis,
which incorporates a simple spatial statistic to determine if the patterns that you’re seeing are statistically significant or not. The hot
spot map is shown here.
So what makes this type of map any less subjective than density-based heat maps? The very dark areas on hot spot maps are statistically significant clusters of high values (hot spots), and the very light areas are statistically significant clusters of low values (cold spots). What’s dark and what’s light is always based on statistical significance. Using hot spot analysis, we can feel confident in the spatial patterns that we see, and in the decisions that we make.(Adapted from: http://resources.arcgis.com/en/communities/analysis/017z00000015000000.htm
Completa o período, indicado pela lacuna II:
Lime is very popular binding material in civil engineering constructions. Properly slaked lime slurry or putty is used as binding material in lime mortar and lime concrete.
Na afirmação os termos lime e mortar podem ser traduzidos, correta e respectivamente, como

Identify the item that best replaces the phrasal verb in bold type.
I’ve finally got over the problem.
I’ve just ran into your sister on the mall.
He tore up all her letters when she decided to move.
The word "framework" can be substituted, without changing of meaning by:
 Conheça nossos planos