Foram encontradas 117 questões
Resolva questões gratuitamente!
Junte-se a mais de 4 milhões de concurseiros!
O mapa abaixo mostra a dispersão das cidades de porte médio no Brasil, em 2010.
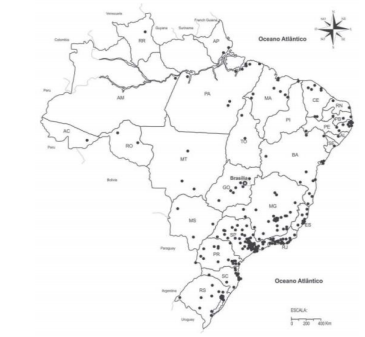
A rede urbana brasileira convive atualmente com um padrão espacial do tipo clássico, em que a hierarquia entre as cidades é bem definida, e um padrão urbano em que algumas cidades, de maior dinamismo, graças à maior eficiência das comunicações, subvertem as noções de hierarquia e de proximidade entre cidades. Cidades com redes técnicas avançadas estão “próximas” a cidades muito distantes, enquanto que cidades vizinhas, em que as redes técnicas são deficientes, mantêm fracas relações entre si. A revolução tecnológica torna as redes urbanas cada vez mais diferenciadas e complexas.
O padrão dominantemente não hierarquizado pode ser observado:
Na organização do espaço urbano brasileiro na contemporaneidade, observa-se uma expansão impulsionada por duas lógicas, a da localização dos empregos nos núcleos das aglomerações e a da localização das moradias nas áreas periféricas. A incorporação de novas áreas residenciais, o aumento da mobilidade e a oferta de transporte eficiente favorecem a formação de arranjos populacionais de diferentes magnitudes que aglutinam diferentes unidades espaciais. Adaptado de: IBGE. Arranjos populacionais e concentrações urbanas no Brasil. Rio de Janeiro: IBGE, 2015. O Instituto Brasileiro de Geografia e Estatística (IBGE) identificou 294 arranjos populacionais no País, formados por 938 municípios e que representam 55,9% da população residente no Brasil em 2010.
Os critérios utilizados na identificação dos arranjos populacionais empregam a noção de integração, medida:
A abordagem neopositivista na Geografia vinculou a noção de região ao funcionalismo, vendo o espaço como um sistema de fluxos em que cada parcela ou subsistema desempenha um conjunto específico de funções. Funda-se, então, a distinção entre as regiões homogêneas ou uniformes e as regiões funcionais ou polarizadas. Adaptado de: HAESBAERT, R. Regional-global: dilemas da região e da regionalização na geografia contemporânea. Rio de Janeiro: Bertrand Brasil, 2010
Diferentemente das regiões funcionais, as regiões homogêneas:
A Política Nacional de Desenvolvimento Regional (PNDR), institucionalizada em 2007, no âmbito do Ministério da Integração nacional, estabeleceu como seus objetivos primordiais a reversão da trajetória das desigualdades regionais no país e a exploração dos potenciais endógenos da base regional brasileira. Para analisar os padrões de desigualdade regional no território brasileiro, foi elaborado um diagnóstico que combinou diversas variáveis, com destaque para o rendimento médio domiciliar, indicador da condição socioeconômica da população, e para a média geométrica do crescimento do PIB per capita, indicador de dinamismo econômico. Os dados foram agregados por microrregiões e, no caso da região Norte, em virtude da grande extensão territorial das unidades político-administrativas, por municípios.
Os cartogramas abaixo indicam as áreas mais dinâmicas do país na década de 1990 e que apresentavam alto e médio rendimento domiciliar por habitante.

“Está longe de ser fácil o trabalho do geógrafo nas zonas pioneiras do Brasil. Sem desprezar as dificuldades materiais, a grande distância entre a cidade de São Paulo e as regiões novas, as deficiências da circulação, a impossibilidade de viajar durante a estação das chuvas, há outras que não enfrentam no mesmo grau os geógrafos acostumados a trabalhar nos países velhos. Nada disso pode surpreender em regiões cujo povoamento está em curso. Mudanças administrativas, incertezas estatísticas, vazios cartográficos, eis outras tantas consequências de um estado de coisas que, a cada dia, se modifica. Tão rápidas são as transformações que tudo que se pode escrever a respeito entra logo na história. Por isso, foi o próprio movimento que eu tentei descrever e explicar: não era possível elaborar uma monografia regional, por isso procurei compor o estudo de uma sociedade em movimento.”
Fonte: MONBEIG, Pierre. Pioneiros e Fazendeiros de São Paulo. São Paulo: Hucitec, 1984, p.18-19
Nos anos 1930 e 1940, Pierre Monbeig estudou a expansão do povoamento em território brasileiro para o oeste de São Paulo e o norte do Paraná. Para compreender as “sociedades em movimento”, Monbeig empregou a noção de “franjas pioneiras”. As franjas pioneiras constituem a expressão geográfica:
A partir de meados do século XVIII, sob a administração do Marquês de Pombal, a Coroa portuguesa promoveu uma série de reformas com o objetivo de ampliar seu controle sobre as colônias na América. Diversas estratégias foram empregadas pela Metrópole no intuito de estender a posse sobre os territórios não ocupados, garantir a soberania sobre as áreas consideradas ocupadas, incentivar o crescimento econômico e aumentar a arrecadação colonial. Adaptado de: MACHADO, L. Mitos e realidade da Amazônia brasileira no contexto geopolítico internacional (1540-1912), tese de doutorado, Universidade de Barcelona, 1989.
Uma das estratégias adotadas pela Coroa portuguesa para ampliar o controle territorial sobre a bacia amazônica no período pombalino consistiu:
O conceito de território é comumente associado à ideia de limites bem definidos e temporalmente estáveis, e tem no Estado Nacional sua principal referência. A geografia, no entanto, vem estudando territorialidades mais flexíveis, como a territorialidade do tráfico de drogas no Rio de Janeiro. Altamente pulverizada, ela contrasta com a estrutura territorial característica de organizações mafiosas ou mesmo do jogo do bicho. No caso do tráfico de drogas, territórios-enclave (favelas) acham-se disseminados pelo tecido urbano, com territórios amigos (pertencentes à mesma organização ou ao mesmo comando) dispersos e separados pelo “asfalto”, para empregar a gíria carioca usual, ou seja, por bairros comuns. Entre duas favelas territorializadas pela mesma organização existe, porém, não apenas “asfalto”; pode haver igualmente territórios inimigos, pertencentes a outro comando. Adaptado de: SOUZA, M. O território: sobre espaço e poder, autonomia e desenvolvimento. In: CASTRO, I. et al. Geografia: Conceitos e Temas. Rio de Janeiro: Bertrand Brasil, 2003: 91-92.
A compreensão do tipo de territorialidade descrita no texto acima implica uma articulação entre o conceito de território e o conceito de:
Após a extração de uma amostra, as observações obtidas são tabuladas, gerando a seguinte distribuição de frequências:
Valor 3 5 9 13
Frequência 5 9 10 3
Considerando que E(X) = Média de X, Mo(X) = Moda de X e Me(X) = Mediana de X, é correto afirmar que:
Sem A, não se tem B.
Sem B, não se tem C.
Assim, conclui-se que:
TEXT II
The backlash against big data
[…]
Big data refers to the idea that society can do things with a large body of data that weren’t possible when working with smaller amounts. The term was originally applied a decade ago to massive datasets from astrophysics, genomics and internet search engines, and to machine-learning systems (for voice-recognition and translation, for example) that work well only when given lots of data to chew on. Now it refers to the application of data-analysis and statistics in new areas, from retailing to human resources. The backlash began in mid-March, prompted by an article in Science by David Lazer and others at Harvard and Northeastern University. It showed that a big-data poster-child—Google Flu Trends, a 2009 project which identified flu outbreaks from search queries alone—had overestimated the number of cases for four years running, compared with reported data from the Centres for Disease Control (CDC). This led to a wider attack on the idea of big data.
The criticisms fall into three areas that are not intrinsic to big data per se, but endemic to data analysis, and have some merit. First, there are biases inherent to data that must not be ignored. That is undeniably the case. Second, some proponents of big data have claimed that theory (ie, generalisable models about how the world works) is obsolete. In fact, subject-area knowledge remains necessary even when dealing with large data sets. Third, the risk of spurious correlations—associations that are statistically robust but happen only by chance—increases with more data. Although there are new statistical techniques to identify and banish spurious correlations, such as running many tests against subsets of the data, this will always be a problem.
There is some merit to the naysayers' case, in other words. But these criticisms do not mean that big-data analysis has no merit whatsoever. Even the Harvard researchers who decried big data "hubris" admitted in Science that melding Google Flu Trends analysis with CDC’s data improved the overall forecast—showing that big data can in fact be a useful tool. And research published in PLOS Computational Biology on April 17th shows it is possible to estimate the prevalence of the flu based on visits to Wikipedia articles related to the illness. Behind the big data backlash is the classic hype cycle, in which a technology’s early proponents make overly grandiose claims, people sling arrows when those promises fall flat, but the technology eventually transforms the world, though not necessarily in ways the pundits expected. It happened with the web, and television, radio, motion pictures and the telegraph before it. Now it is simply big data’s turn to face the grumblers.
(From http://www.economist.com/blogs/economist explains/201 4/04/economist-explains-10)
TEXT I
Will computers ever truly understand what we’re saying?
Date: January 11, 2016
Source University of California - Berkeley
Summary:
If you think computers are quickly approaching true human communication, think again. Computers like Siri often get confused because they judge meaning by looking at a word’s statistical regularity. This is unlike humans, for whom context is more important than the word or signal, according to a researcher who invented a communication game allowing only nonverbal cues, and used it to pinpoint regions of the brain where mutual understanding takes place.
From Apple’s Siri to Honda’s robot Asimo, machines seem to be getting better and better at communicating with humans. But some neuroscientists caution that today’s computers will never truly understand what we’re saying because they do not take into account the context of a conversation the way people do.
Specifically, say University of California, Berkeley, postdoctoral fellow Arjen Stolk and his Dutch colleagues, machines don’t develop a shared understanding of the people, place and situation - often including a long social history - that is key to human communication. Without such common ground, a computer cannot help but be confused.
“People tend to think of communication as an exchange of linguistic signs or gestures, forgetting that much of communication is about the social context, about who you are communicating with,” Stolk said.
The word “bank,” for example, would be interpreted one way if you’re holding a credit card but a different way if you’re holding a fishing pole. Without context, making a “V” with two fingers could mean victory, the number two, or “these are the two fingers I broke.”
“All these subtleties are quite crucial to understanding one another,” Stolk said, perhaps more so than the words and signals that computers and many neuroscientists focus on as the key to communication. “In fact, we can understand one another without language, without words and signs that already have a shared meaning.”
(Adapted from http://www.sciencedaily.com/releases/2016/01/1 60111135231.htm)