Questões de Concurso
Sobre interpretação de texto | reading comprehension em inglês
Foram encontradas 12.709 questões


Technology plays a key role in teenage romance from initial encounters to eventual break-ups, says a US study.
Teenagers rarely meet online but do use technology for flirting, asking out, meeting up and parting, American think tank, the Pew Research Center, found. A survey of 1,060 US teenagers aged 13 to 17 revealed that technology brings them closer but also breeds jealousy.
"Digital platforms are powerful tools for teens," said Amanda Lenhart, lead author of the report from Pew. "But even as teens enjoy greater closeness with partners and a chance to display their relationships for others to see, mobile and social media can also be tools for jealousy, meddling and even troubling behaviour."
Digital romance, broken down
Of the 1,060 teenagers surveyed:
• 35% said they were currently dating and 59% of that group said technology made them feel closer to their partner
• For boys who were dating, 65% said social media made them more connected to a significant other while it was 52% for girls
• 27% of dating teenagers thought social media made them feel jealous or insecure in relationships
• 50% of all teens surveyed, dating or not, said they had indicated interest by friending someone on Facebook or other social media and 47% expressed attraction by likes and comments
• Texting is king - 92% of teens who were dating said they texted a partner, assuming the partner would check in with "great regularity"
• Jealousy happens, but not as much as flirting does - 11% of teenage daters reported accessing a partner's online accounts and 16% reported having a partner asking them to de-friend someone
What gets discussed during all those frequent social media enabled check-ins? According to the survey, it is mostly "funny stuff" followed by "things you're thinking about" as well as other Information such as where they are and what their friends have been doing. And forget having to meet up to resolve a conflict - 48% of dating teenagers said that could be done by texting or talking online. Online tools, with their accessibility and ease of use, also showed some signs of giving this group relationship anxiety. Females are more likely to be subject to unwanted flirting and 25% of teenagers surveyed said they have blocked or unfriended someone because of uncomfortable flirting. And 15% of teenage daters said a partner had used the internet to pressure them into unwanted sexual activity.
'More than emojis'
Nearly half the respondents admitted to concentrating on their phone ahead of their partner when together with 43% of dating teens saying that had happened to them. "I don't think this survey reveals much that is surprising. But it is affirming. Humans are social animals and we build tools to connect with each other, "wrote Julie Beck, an associate editor at The Atlantic news site, of the survey's findings.
"It's not all heart emojis all the time, no, but the tools that facilitate relationships facilitate all aspects of them, good and bad.
"Connecting with others is scary, hard, sometimes dangerous, but usually, hopefully, good. The teens get it."
(Fonte: http://www.bbc.com/news/technology-34416989)
Technology plays a key role in teenage romance from initial encounters to eventual break-ups, says a US study.
Teenagers rarely meet online but do use technology for flirting, asking out, meeting up and parting, American think tank, the Pew Research Center, found. A survey of 1,060 US teenagers aged 13 to 17 revealed that technology brings them closer but also breeds jealousy.
"Digital platforms are powerful tools for teens," said Amanda Lenhart, lead author of the report from Pew. "But even as teens enjoy greater closeness with partners and a chance to display their relationships for others to see, mobile and social media can also be tools for jealousy, meddling and even troubling behaviour."
Digital romance, broken down
Of the 1,060 teenagers surveyed:
• 35% said they were currently dating and 59% of that group said technology made them feel closer to their partner
• For boys who were dating, 65% said social media made them more connected to a significant other while it was 52% for girls
• 27% of dating teenagers thought social media made them feel jealous or insecure in relationships
• 50% of all teens surveyed, dating or not, said they had indicated interest by friending someone on Facebook or other social media and 47% expressed attraction by likes and comments
• Texting is king - 92% of teens who were dating said they texted a partner, assuming the partner would check in with "great regularity"
• Jealousy happens, but not as much as flirting does - 11% of teenage daters reported accessing a partner's online accounts and 16% reported having a partner asking them to de-friend someone
What gets discussed during all those frequent social media enabled check-ins? According to the survey, it is mostly "funny stuff" followed by "things you're thinking about" as well as other Information such as where they are and what their friends have been doing. And forget having to meet up to resolve a conflict - 48% of dating teenagers said that could be done by texting or talking online. Online tools, with their accessibility and ease of use, also showed some signs of giving this group relationship anxiety. Females are more likely to be subject to unwanted flirting and 25% of teenagers surveyed said they have blocked or unfriended someone because of uncomfortable flirting. And 15% of teenage daters said a partner had used the internet to pressure them into unwanted sexual activity.
'More than emojis'
Nearly half the respondents admitted to concentrating on their phone ahead of their partner when together with 43% of dating teens saying that had happened to them. "I don't think this survey reveals much that is surprising. But it is affirming. Humans are social animals and we build tools to connect with each other, "wrote Julie Beck, an associate editor at The Atlantic news site, of the survey's findings.
"It's not all heart emojis all the time, no, but the tools that facilitate relationships facilitate all aspects of them, good and bad.
"Connecting with others is scary, hard, sometimes dangerous, but usually, hopefully, good. The teens get it."
(Fonte: http://www.bbc.com/news/technology-34416989)
Technology plays a key role in teenage romance from initial encounters to eventual break-ups, says a US study.
Teenagers rarely meet online but do use technology for flirting, asking out, meeting up and parting, American think tank, the Pew Research Center, found. A survey of 1,060 US teenagers aged 13 to 17 revealed that technology brings them closer but also breeds jealousy.
"Digital platforms are powerful tools for teens," said Amanda Lenhart, lead author of the report from Pew. "But even as teens enjoy greater closeness with partners and a chance to display their relationships for others to see, mobile and social media can also be tools for jealousy, meddling and even troubling behaviour."
Digital romance, broken down
Of the 1,060 teenagers surveyed:
• 35% said they were currently dating and 59% of that group said technology made them feel closer to their partner
• For boys who were dating, 65% said social media made them more connected to a significant other while it was 52% for girls
• 27% of dating teenagers thought social media made them feel jealous or insecure in relationships
• 50% of all teens surveyed, dating or not, said they had indicated interest by friending someone on Facebook or other social media and 47% expressed attraction by likes and comments
• Texting is king - 92% of teens who were dating said they texted a partner, assuming the partner would check in with "great regularity"
• Jealousy happens, but not as much as flirting does - 11% of teenage daters reported accessing a partner's online accounts and 16% reported having a partner asking them to de-friend someone
What gets discussed during all those frequent social media enabled check-ins? According to the survey, it is mostly "funny stuff" followed by "things you're thinking about" as well as other Information such as where they are and what their friends have been doing. And forget having to meet up to resolve a conflict - 48% of dating teenagers said that could be done by texting or talking online. Online tools, with their accessibility and ease of use, also showed some signs of giving this group relationship anxiety. Females are more likely to be subject to unwanted flirting and 25% of teenagers surveyed said they have blocked or unfriended someone because of uncomfortable flirting. And 15% of teenage daters said a partner had used the internet to pressure them into unwanted sexual activity.
'More than emojis'
Nearly half the respondents admitted to concentrating on their phone ahead of their partner when together with 43% of dating teens saying that had happened to them. "I don't think this survey reveals much that is surprising. But it is affirming. Humans are social animals and we build tools to connect with each other, "wrote Julie Beck, an associate editor at The Atlantic news site, of the survey's findings.
"It's not all heart emojis all the time, no, but the tools that facilitate relationships facilitate all aspects of them, good and bad.
"Connecting with others is scary, hard, sometimes dangerous, but usually, hopefully, good. The teens get it."
(Fonte: http://www.bbc.com/news/technology-34416989)
Technology plays a key role in teenage romance from initial encounters to eventual break-ups, says a US study.
Teenagers rarely meet online but do use technology for flirting, asking out, meeting up and parting, American think tank, the Pew Research Center, found. A survey of 1,060 US teenagers aged 13 to 17 revealed that technology brings them closer but also breeds jealousy.
"Digital platforms are powerful tools for teens," said Amanda Lenhart, lead author of the report from Pew. "But even as teens enjoy greater closeness with partners and a chance to display their relationships for others to see, mobile and social media can also be tools for jealousy, meddling and even troubling behaviour."
Digital romance, broken down
Of the 1,060 teenagers surveyed:
• 35% said they were currently dating and 59% of that group said technology made them feel closer to their partner
• For boys who were dating, 65% said social media made them more connected to a significant other while it was 52% for girls
• 27% of dating teenagers thought social media made them feel jealous or insecure in relationships
• 50% of all teens surveyed, dating or not, said they had indicated interest by friending someone on Facebook or other social media and 47% expressed attraction by likes and comments
• Texting is king - 92% of teens who were dating said they texted a partner, assuming the partner would check in with "great regularity"
• Jealousy happens, but not as much as flirting does - 11% of teenage daters reported accessing a partner's online accounts and 16% reported having a partner asking them to de-friend someone
What gets discussed during all those frequent social media enabled check-ins? According to the survey, it is mostly "funny stuff" followed by "things you're thinking about" as well as other Information such as where they are and what their friends have been doing. And forget having to meet up to resolve a conflict - 48% of dating teenagers said that could be done by texting or talking online. Online tools, with their accessibility and ease of use, also showed some signs of giving this group relationship anxiety. Females are more likely to be subject to unwanted flirting and 25% of teenagers surveyed said they have blocked or unfriended someone because of uncomfortable flirting. And 15% of teenage daters said a partner had used the internet to pressure them into unwanted sexual activity.
'More than emojis'
Nearly half the respondents admitted to concentrating on their phone ahead of their partner when together with 43% of dating teens saying that had happened to them. "I don't think this survey reveals much that is surprising. But it is affirming. Humans are social animals and we build tools to connect with each other, "wrote Julie Beck, an associate editor at The Atlantic news site, of the survey's findings.
"It's not all heart emojis all the time, no, but the tools that facilitate relationships facilitate all aspects of them, good and bad.
"Connecting with others is scary, hard, sometimes dangerous, but usually, hopefully, good. The teens get it."
(Fonte: http://www.bbc.com/news/technology-34416989)
Sustainable mining – oxymoron or a way of the future?
Mining is an activity that has persisted since the start of humans using tools. However, one might argue that digging a big hole in the ground and selling the finite resources that come out of that hole is not sustainable, especially when the digging involves the use of other finite resources (i.e. fuels) and produces a lot of greenhouse gases.
The counter argument could go along the lines that minerals are not being lost or destroyed through mining and mineral processing – the elements are being shifted around, and converted into new forms. Metals can even be extracted from waste, seawater or even sewage, and recycled. But a more simple argument is possible: a mine can be sustainable if it is economically, socially and environmentally beneficial in the short and long term. To be sustainable, the positive benefits of mining should outweigh any negative impacts. […]
Social positives are often associated with mines in regional areas, such as providing better amenities in a nearby town, or providing employment (an economic and social positive). Social negatives can also occur, such as dust, noise, traffic and visual amenity. These are commonly debated and, whilst sometimes controversial, can be managed with sufficient corporate commitment, stakeholder engagement, and enough time to work through the issues. Time is the key parameter - it may take several years for a respectful process of community input, but as long as it is possible for social negatives to be outweighed by social positives, then the project will be socially sustainable.
It is most likely that a mine development will have some environmental negatives, such as direct impacts on flora and fauna through clearing of vegetation and habitat within the mine footprint. Some mines will have impacts which extend beyond the mine site, such as disruption to groundwater, production of silt and disposal of waste. Certainly these impacts will need to be managed throughout the mine life, along with robust rehabilitation and closure planning. […]
The real turning point will come when mining companies go beyond environmental compliance to create 'heritage projects' that can enhance the environmental or social benefits in a substantial way – by more than the environmental offsets needed just to make up for the negatives created by the mine. In order to foster these innovative mining heritage projects we need to promote 'sustainability assessments' - not just 'environmental assessments'. This will lead to a more mature appreciation of the whole system whereby the economic and social factors, as well as environmental factors, are considered in a holistic manner.
(adapted from https://www.engineersaustralia.org.au/western-australia-division/sustainable-mining-oxymoron-or-way-future. Retrieved on August 10, 2015)
Sustainable mining – oxymoron or a way of the future?
Mining is an activity that has persisted since the start of humans using tools. However, one might argue that digging a big hole in the ground and selling the finite resources that come out of that hole is not sustainable, especially when the digging involves the use of other finite resources (i.e. fuels) and produces a lot of greenhouse gases.
The counter argument could go along the lines that minerals are not being lost or destroyed through mining and mineral processing – the elements are being shifted around, and converted into new forms. Metals can even be extracted from waste, seawater or even sewage, and recycled. But a more simple argument is possible: a mine can be sustainable if it is economically, socially and environmentally beneficial in the short and long term. To be sustainable, the positive benefits of mining should outweigh any negative impacts. […]
Social positives are often associated with mines in regional areas, such as providing better amenities in a nearby town, or providing employment (an economic and social positive). Social negatives can also occur, such as dust, noise, traffic and visual amenity. These are commonly debated and, whilst sometimes controversial, can be managed with sufficient corporate commitment, stakeholder engagement, and enough time to work through the issues. Time is the key parameter - it may take several years for a respectful process of community input, but as long as it is possible for social negatives to be outweighed by social positives, then the project will be socially sustainable.
It is most likely that a mine development will have some environmental negatives, such as direct impacts on flora and fauna through clearing of vegetation and habitat within the mine footprint. Some mines will have impacts which extend beyond the mine site, such as disruption to groundwater, production of silt and disposal of waste. Certainly these impacts will need to be managed throughout the mine life, along with robust rehabilitation and closure planning. […]
The real turning point will come when mining companies go beyond environmental compliance to create 'heritage projects' that can enhance the environmental or social benefits in a substantial way – by more than the environmental offsets needed just to make up for the negatives created by the mine. In order to foster these innovative mining heritage projects we need to promote 'sustainability assessments' - not just 'environmental assessments'. This will lead to a more mature appreciation of the whole system whereby the economic and social factors, as well as environmental factors, are considered in a holistic manner.
(adapted from https://www.engineersaustralia.org.au/western-australia-division/sustainable-mining-oxymoron-or-way-future. Retrieved on August 10, 2015)
Sustainable mining – oxymoron or a way of the future?
Mining is an activity that has persisted since the start of humans using tools. However, one might argue that digging a big hole in the ground and selling the finite resources that come out of that hole is not sustainable, especially when the digging involves the use of other finite resources (i.e. fuels) and produces a lot of greenhouse gases.
The counter argument could go along the lines that minerals are not being lost or destroyed through mining and mineral processing – the elements are being shifted around, and converted into new forms. Metals can even be extracted from waste, seawater or even sewage, and recycled. But a more simple argument is possible: a mine can be sustainable if it is economically, socially and environmentally beneficial in the short and long term. To be sustainable, the positive benefits of mining should outweigh any negative impacts. […]
Social positives are often associated with mines in regional areas, such as providing better amenities in a nearby town, or providing employment (an economic and social positive). Social negatives can also occur, such as dust, noise, traffic and visual amenity. These are commonly debated and, whilst sometimes controversial, can be managed with sufficient corporate commitment, stakeholder engagement, and enough time to work through the issues. Time is the key parameter - it may take several years for a respectful process of community input, but as long as it is possible for social negatives to be outweighed by social positives, then the project will be socially sustainable.
It is most likely that a mine development will have some environmental negatives, such as direct impacts on flora and fauna through clearing of vegetation and habitat within the mine footprint. Some mines will have impacts which extend beyond the mine site, such as disruption to groundwater, production of silt and disposal of waste. Certainly these impacts will need to be managed throughout the mine life, along with robust rehabilitation and closure planning. […]
The real turning point will come when mining companies go beyond environmental compliance to create 'heritage projects' that can enhance the environmental or social benefits in a substantial way – by more than the environmental offsets needed just to make up for the negatives created by the mine. In order to foster these innovative mining heritage projects we need to promote 'sustainability assessments' - not just 'environmental assessments'. This will lead to a more mature appreciation of the whole system whereby the economic and social factors, as well as environmental factors, are considered in a holistic manner.
(adapted from https://www.engineersaustralia.org.au/western-australia-division/sustainable-mining-oxymoron-or-way-future. Retrieved on August 10, 2015)
I - It is well-known that the resources extracted from mines are endless.
II - The social negative impacts of mining may be minimized as time goes by.
III - Sustainable assessment has a wider field of action than environmental assessment.
IV - There is agreement that negative impacts of mining are restricted to the site.
The correct sentences are only:
Innovation is the new key to survival
[…]
At its most basic, innovation presents an optimal strategy for controlling costs. Companies that have invested in such technologies as remote mining, autonomous equipment and driverless trucks and trains have reduced expenses by orders of magnitude, while simultaneously driving up productivity.
Yet, gazing towards the horizon, it is rapidly becoming clear that innovation can do much more than reduce capital intensity. Approached strategically, it also has the power to reduce people and energy intensity, while increasing mining intensity.
Capturing the learnings
The key is to think of innovation as much more than research and development (R&D) around particular processes or technologies. Companies can, in fact, innovate in multiple ways, such as leveraging supplier knowledge around specific operational challenges, redefining their participation in the energy value chain or finding new ways to engage and partner with major stakeholders and constituencies.
To reap these rewards, however, mining companies must overcome their traditionally conservative tendencies. In many cases, miners struggle to adopt technologies proven to work at other mining companies, let alone those from other industries. As a result, innovation becomes less of a technology problem and more of an adoption problem.
By breaking this mindset, mining companies can free themselves to adapt practical applications that already exist in other industries and apply them to fit their current needs. For instance, the tunnel boring machines used by civil engineers to excavate the Chunnel can vastly reduce miners' reliance on explosives. Until recently, those machines were too large to apply in a mining setting. Some innovators, however, are now incorporating the underlying technology to build smaller machines—effectively adapting mature solutions from other industries to realize more rapid results.
Re-imagining the future
At the same time, innovation mandates companies to think in entirely new ways. Traditionally, for instance, miners have focused on extracting higher grades and achieving faster throughput by optimizing the pit, schedule, product mix and logistics. A truly innovative mindset, however, will see them adopt an entirely new design paradigm that leverages new information, mining and energy technologies to maximize value. […]
Approached in this way, innovation can drive more than cost reduction. It can help mining companies mitigate and manage risks, strengthen business models and foster more effective community and government relations. It can help mining services companies enhance their value to the industry by developing new products and services. Longer-term, it can even position organizations to move the needle on such endemic issues as corporate social responsibility, environmental performance and sustainability.
(http://www2.deloitte.com/content/dam/Deloitte/ru/Document s/energy-resources/ru_er_tracking_the_trends_2015_eng.pdf)

Mining tourism in Ouro Preto
Ouro Preto is surrounded by a rich and varied natural environment with waterfalls, hiking trails and native vegetation partially protected as state parks. Parts of these resources are used for tourism. Paradoxically, this ecosystem contrasts with the human occupation of the region that produced, after centuries, a rich history and a cultural connection to mining, its oldest economic activity which triggered occupation. The region has an unlimited potential for tourism, especially in specific segments such as mining heritage tourism, in association or not with the existing ecotourism market. In fact, in Ouro Preto, tourism, history, geology and mining are often hard to distinguish; such is the inter-relationship between these segments.
For centuries, a major problem of mining has been the reuse of the affected areas. Modern mining projects proposed solutions to this problem right from the initial stages of operation, which did not happen until recently. As a result, most quarries and other old mining areas that do not have an appropriate destination represent serious environmental problems. Mining tourism utilizing exhausted mines is a source of employment and income. Tourism activities may even contribute to the recovery of degraded areas in various ways, such as reforestation for leisure purposes, or their transformation into history museums where aspects of local mining are interpreted.
Minas Gerais, and particularly Ouro Preto, provides the strong and rich cultural and historical content needed for the transformation of mining remnants into attractive tourism products, especially when combined with the existing cultural tourism of the region. Although mining tourism is explored in various parts of the world in extremely different social, economic, cultural and natural contexts, in Brazil it is still not a strategy readily adopted as an alternative for areas affected by mining activities.
(Lohmann, G. M.; Flecha, A. C.; Knupp, M. E. C. G.; Liccardo, A. (2011). Mining tourism in Ouro Preto, Brazil: opportunities and challenges. In: M. V. Conlin; L. Jolliffe (eds).Mining heritage and tourism: a global synthesis. New York: Routledge, pp. 194-202.)
Mining tourism in Ouro Preto
Ouro Preto is surrounded by a rich and varied natural environment with waterfalls, hiking trails and native vegetation partially protected as state parks. Parts of these resources are used for tourism. Paradoxically, this ecosystem contrasts with the human occupation of the region that produced, after centuries, a rich history and a cultural connection to mining, its oldest economic activity which triggered occupation. The region has an unlimited potential for tourism, especially in specific segments such as mining heritage tourism, in association or not with the existing ecotourism market. In fact, in Ouro Preto, tourism, history, geology and mining are often hard to distinguish; such is the inter-relationship between these segments.
For centuries, a major problem of mining has been the reuse of the affected areas. Modern mining projects proposed solutions to this problem right from the initial stages of operation, which did not happen until recently. As a result, most quarries and other old mining areas that do not have an appropriate destination represent serious environmental problems. Mining tourism utilizing exhausted mines is a source of employment and income. Tourism activities may even contribute to the recovery of degraded areas in various ways, such as reforestation for leisure purposes, or their transformation into history museums where aspects of local mining are interpreted.
Minas Gerais, and particularly Ouro Preto, provides the strong and rich cultural and historical content needed for the transformation of mining remnants into attractive tourism products, especially when combined with the existing cultural tourism of the region. Although mining tourism is explored in various parts of the world in extremely different social, economic, cultural and natural contexts, in Brazil it is still not a strategy readily adopted as an alternative for areas affected by mining activities.
(Lohmann, G. M.; Flecha, A. C.; Knupp, M. E. C. G.; Liccardo, A. (2011). Mining tourism in Ouro Preto, Brazil: opportunities and challenges. In: M. V. Conlin; L. Jolliffe (eds).Mining heritage and tourism: a global synthesis. New York: Routledge, pp. 194-202.)
Mining tourism in Ouro Preto
Ouro Preto is surrounded by a rich and varied natural environment with waterfalls, hiking trails and native vegetation partially protected as state parks. Parts of these resources are used for tourism. Paradoxically, this ecosystem contrasts with the human occupation of the region that produced, after centuries, a rich history and a cultural connection to mining, its oldest economic activity which triggered occupation. The region has an unlimited potential for tourism, especially in specific segments such as mining heritage tourism, in association or not with the existing ecotourism market. In fact, in Ouro Preto, tourism, history, geology and mining are often hard to distinguish; such is the inter-relationship between these segments.
For centuries, a major problem of mining has been the reuse of the affected areas. Modern mining projects proposed solutions to this problem right from the initial stages of operation, which did not happen until recently. As a result, most quarries and other old mining areas that do not have an appropriate destination represent serious environmental problems. Mining tourism utilizing exhausted mines is a source of employment and income. Tourism activities may even contribute to the recovery of degraded areas in various ways, such as reforestation for leisure purposes, or their transformation into history museums where aspects of local mining are interpreted.
Minas Gerais, and particularly Ouro Preto, provides the strong and rich cultural and historical content needed for the transformation of mining remnants into attractive tourism products, especially when combined with the existing cultural tourism of the region. Although mining tourism is explored in various parts of the world in extremely different social, economic, cultural and natural contexts, in Brazil it is still not a strategy readily adopted as an alternative for areas affected by mining activities.
(Lohmann, G. M.; Flecha, A. C.; Knupp, M. E. C. G.; Liccardo, A. (2011). Mining tourism in Ouro Preto, Brazil: opportunities and challenges. In: M. V. Conlin; L. Jolliffe (eds).Mining heritage and tourism: a global synthesis. New York: Routledge, pp. 194-202.)
( ) Tourism may actually be quite beneficial to some degraded mining areas.
( ) Mining tourism has recently been promptly embraced by Brazilian regions.
( ) Ouro Preto is attracting people because mining is one of its most recent activities.
The correct sequence is:

(www.starling-fitness.com)
O quadrinho faz uma crítica
For the Olympic Games in Rio de Janeiro 2016, many tourists look for apartments and accommodation in the south area. However, the games will take place in Barra da Tijuca. The easiest means of transport is the metro.
Em relação às informações acima, é INCORRETO afirmar que
After interviewing gurus that counsel both men and women on dating, we noticed something that was quite curious. Some of their dating advice was actually gender-neutral and could be applied to both sexes. As we see it, good advice is good advice. Here are the top five dating tips for both men and women:
1. Be open minded.
2. Don't research before a first date. You can “Google them" later.
3. Don't bring baggage. Avoid talking about past relationships.
4. Be honest about yourself. Starting a relationship based on lies is never a good idea.
5. Leave on a high note. Keep things short and sweet. Better to leave the other person wanting more.
<www.newszoom.com> Acessed on: August 10th, 2014.
According to the text, it's CORRECT to say that:
In 1985, Frejat, then guitarist for Barão Vermelho, hit the stage wearing green and yellow clothes. It was January 15th, the day in which Tancredo Neves was named president of Brazil. Cazuza sang “Pro Dia Nascer Feliz" with lots of enthusiasm.
Frejat returns to the festival this year for a solo performance on October 1st.
Disponível em: TAM. TAM nas nuvens. São Paulo: New Content Editora, set/2011.
Que elemento linguístico do texto em inglês indica que Frejat já saiu da banda Barão Vermelho?
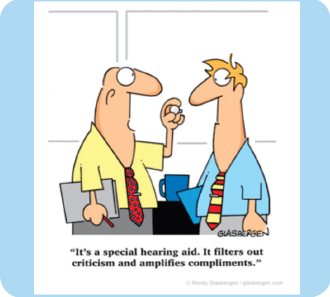
http://www.glasbergen.com/stress-management-cartoons/
The device being offered in the cartoon is special because it will help the employee:
TEXT 2
Women in Computing

(http://static.guim.co.uk/sys-images/Guardian/Pix/pictures/2013/3/19/1363705626950/women-at-computers-003.jpg accessed October 26th, 2015)
The Next Generation
Technology is rapidly evolving, but the low number of women in computer science and engineering remains stagnant and experts say that this could have major implications for the future.
“Computing is at the heart of everything,” says Dr. Telle Whitney, CEO of the Anita Borg Institute and co-founder of Grace Hopper Celebration. “To be missing half the population is a significant loss to our world.
In 2014, women made up only 22 percent of the science, technology, engineering, mathematics, and computer science (STEM) workforce. The number of Canadian women working in STEM fields has barely changed in the past three decades.
“Women look at the world a little differently than men and I think we have a huge opportunity to disrupt and play a big role in the technology space,” says Vicki Saunders, founder of SheEO, an initiative that supports female entrepreneurs.[…]
(MACLEAN’S, October 12th, 2015, p. 1)
( ) Specialists are worried about the low wages women get in computing and engineering.
( ) “SheEO” aims at assisting women who want to engage in the world of business.
( ) The position of women in the technological world today poses no threats for the next generation.
The statements are, respectively:
TEXT 2
Women in Computing
(http://static.guim.co.uk/sys-images/Guardian/Pix/pictures/2013/3/19/1363705626950/women-at-computers-003.jpg accessed October 26th, 2015)
The Next Generation
Technology is rapidly evolving, but the low number of women in computer science and engineering remains stagnant and experts say that this could have major implications for the future.
“Computing is at the heart of everything,” says Dr. Telle Whitney, CEO of the Anita Borg Institute and co-founder of Grace Hopper Celebration. “To be missing half the population is a significant loss to our world.
In 2014, women made up only 22 percent of the science, technology, engineering, mathematics, and computer science (STEM) workforce. The number of Canadian women working in STEM fields has barely changed in the past three decades.
“Women look at the world a little differently than men and I think we have a huge opportunity to disrupt and play a big role in the technology space,” says Vicki Saunders, founder of SheEO, an initiative that supports female entrepreneurs.[…]
(MACLEAN’S, October 12th, 2015, p. 1)

The professional responsibilities of IT-managers are described as unchangeable.
 Conheça nossos planos