O trecho do texto que pode ser confirmado no gráfico é:
Próximas questões
Com base no mesmo assunto
Ano: 2025
Banca:
VUNESP
Órgão:
UNIFIPA
Prova:
VUNESP - 2025 - UNIFIPA - Vestibular Medicina - Conhecimentos Gerais |
Q3966812
Inglês
Texto associado
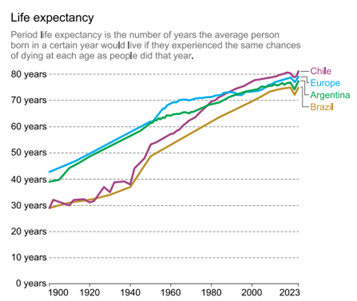
Leia o texto e analise o gráfico para responder à questão.
Life Expectancy (1900-2023)
People are living longer. In 1900, the average life
expectancy of a newborn was 32 years. By 2021 this had
more than doubled to 71 years.
The large reduction in child mortality has played
an important role in increasing life expectancy. But life
expectancy has increased at all ages. Infants, children,
adults, and the elderly are all less likely to die than in the
past, and death is being delayed. This remarkable shift
results from advances in medicine, public health, and living
standards. Along with it, many predictions of the “limit” of life
expectancy have been broken.
(Saloni Dattani et al. https://ourworldindata.org, 2023. Adaptado.)
O trecho do texto que pode ser confirmado no gráfico é: